- Point of view
Targeted transparency and the hyperconnected supply chain
How improving the accuracy of OTIF and other baseline KPIs can drive productivity, performance, and profitability
The early bird gets the worm – unless you're a consumer packaged goods (CPG) company delivering a shipment to a major retailer. In that case, being early may get you a fine. As could sending a late or incomplete order.
As consumers continue to demand new levels of choice, convenience, and availability, retailers have placed new emphasis on manufacturers' ability to meet on-time, in-full (OTIF) delivery targets, making it one of the most crucial issues facing CPG brands today.
But a high OTIF rate doesn't necessarily spell success. As a baseline metric, OTIF is also used to calculate other key performance indicators (KPIs) like cost to serve. As such, slight inaccuracies in the OTIF metric can lead to imprecision further down the line, compounding inefficiencies over time. Getting the OTIF number right is just as important as keeping it high.
What's standing in the way of your performance and report metrics?
For most CPG organizations, there are two obstacles preventing the accurate calculation of OTIF performance and report metrics:
- IT sprawl, which makes it difficult to gather complete, accurate, and timely data across all systems and functions
- Inconsistent process standards across functions, subsidiaries, vendors, and even customers that make it difficult or impossible to compare figures
These two factors set off a chain reaction within the business. Tech sprawl and a lack of standardization results in poor visibility. Lack of transparency leads to poor resource allocation. Misappropriated resources lead to poor business performance. And poor performance can lead to fines, revenue leaks, or lost profits.
The obvious solution for this issue is to integrate the disparate systems and tools, the most significant of which are the various ERP systems used by the business. But ERP integration is a notoriously time-consuming, complex, and costly process, the benefits of which often take considerable time to realize.
Because of this, we believe that the key to achieving transparency is accepting that you don't need complete information on everything, but must be able to answer some key questions:
- Are you fulfilling market demand? Then you need total quantity delivered against total quantity ordered by customers to calculate pack-fill-rate (PFR)
- Are your customers satisfied? Then you need to know whether orders were on time or not to calculate OTIF
- Are you prepared to (efficiently) serve customer demand? Then you need to compare sales against customer orders to calculate forecast accuracy
- Is there too much bounded capital in the supply chain? Then you need to compare inventory levels and demand to calculate days of inventory
- Are your suppliers helping you fulfill customer demand? Then you need to calculate supplier OTIF
By ensuring consistency of the data streams related to KPIs and the underlying processes, it's possible to improve transparency and visibility where it matters most. We call this targeted transparency. It's a pragmatic approach that can mitigate most of the problems associated with lack of visibility so that organizations can achieve fast results.
Targeted transparency: What's in it for you?
Organizations that improve their targeted transparency reap three distinct rewards:
Time: Central management teams can reallocate on average over 6,000 hours of work per year that is typically earmarked for data collection and reporting
Profits: Sound data makes for better operations. Improving the accuracy of key metrics can produce cost savings equal to 5% of overall inventory
Efficiency: By using data analytics to prioritize and act on improvement levers, further operational improvements can be achieved, including an additional 5% reduction in overall inventory as well as €1 million of additional revenue per €1 billion of sales for each 5% incremental improvement in OTIF
Six steps to achieving targeted transparency (and building a hyperconnected supply chain)
Targeted transparency is a necessary component in building a hyperconnected supply chain. There are six key steps to enabling the targeted transparency that will drive supply chain optimization.
1. Put the K in KPI
How long is your list of KPIs? Do you have five? Ten?
Based on our theory of targeted transparency, less is more – at least at the outset.
Reduce your list of KPIs to those truly essential metrics that are most aligned with the business's key success factors. Usually you should start with those related to customer satisfaction and market demand fulfillment, measured with OTIF and PFR respectively.
These are the indicators that will not only assess current performance, but also serve as the foundation for future metrics, like cost to serve. That's why it's so important to get these initial KPIs right. Miscalculations here will be compounded later.
2. Defining and communicating KPIs
It is common, and even expected, that subsidiaries use different versions of a KPI – with different thresholds and bases of calculation. But the expected doesn't always live up to expectations.
KPIs need to be easy to understand, easy to calculate, and easy to communicate across all business units, functions, and subsidiaries. To that end, we recommend that KPIs meet our CPA check:
Is the KPI common? Do all parties use the exact same calculation method?
Is the KPI precise? Is the calculation method, its components, and its intent rigorously set?
Is the KPI agnostic? Are pre-calculations formulated to avoid assumptions?
These principles also apply to KPIs with third-party logistics providers and even customers themselves. To that end, include the mathematical definitions in each contract and formalize the basis of calculation as well as communication channels for every shipment with every vendor, customer, or other stakeholder.
3. Build a data warehouse
Your IT infrastructure should support the targeted transparency initiative. But, as already noted, it's not necessary to consolidate multiple ERP systems. Rather, the organization only needs a separate repository where relevant, timely, clean data can be collected in a standardized way.
Enter the data warehouse. Whether hosted on the cloud or a traditional on-prem repository, this approach splits data integration from business analytics. The result? Analysts can focus on their job without being burdened with data integration tasks.
Integration of data does not necessarily need to be done internally. In some cases, external cloud services are more appropriate, especially if data that is originating from many systems helps coordinate the activity of various entities.
4. Locate, analyze, and join data streams
Once the exact operational definitions for tier-one KPIs, such as OTIF and PFR, are validated, a cross-functional supply chain and IT team must work together to identify the required data streams. This may include customer order data at its granular level from different subsidiaries and other transactional data.
To be able to match data correctly, the team must pay special attention to master data and transactional data. If these data streams are not well maintained, the business may need to set up a separate initiative for its cleansing.
Admittedly, this is a complicated process and the organization should not expect that all data streams can be seamlessly combined. We set the benchmark of 80/20: collect the data in the data warehouse, determine the most common inconsistencies, and address them through automation. Once this is done, the data can be visualized in business intelligence tools and used for root cause analysis and decision making.
5. Standardize critical processes
Since different parts of the business have different processes that affect the customer order data streams, it's important to identify those that have the biggest impact on a KPI. The business can then launch an initiative to standardize customer order processing.
This often involves incentivizing subsidiaries to complete the process within ERP (as opposed to working on Excel extracts) and ensuring that order statuses, such as open, confirmed, or rejected, are used consistently.
Again, we recommend an 80/20 approach, rolling it out across the subsidiaries by priority and implementing automated workflows on the data streams whenever there is an obvious calculation that can be streamlined.
6. Repeat and reap
Having the proper IT architecture and the essential KPIs in place drastically increases transparency. With these key pieces in place, the business can establish a KPI roadmap to prioritize other indicators that will generate valuable insights. Once the roadmap is established, the company can apply the targeted transparency method to a new batch of KPIs.
As more KPIs are integrated, the centralized data will grow. This, in turn, enables the deployment of advanced analytics models. The more digitally mature the organization, the easier it will be to identify root causes of inefficiencies and create optimal plans for improved performance.
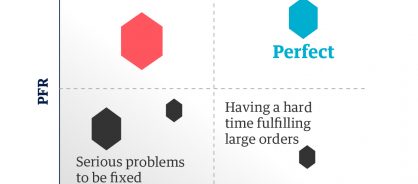
KPI combos: When more is more
When selecting KPIs, it's important to consider how indicators interact with and influence one another, as well as how new insights might be generated by looking at two or more KPIs simultaneously. For example, a major European pharmaceutical company combined OTIF and PFR into a framework that not only provided stakeholders with the information they needed, but also helped in deriving operational insights as shown below.
Combination of essential KPIs
Case study
Getting the data that counts from over 50 ERP systems
A major agricultural company used ClearOps, a supply chain management cloud platform, to manage data streams from more than 50 different systems across various organizations in order to improve inventory visibility and strengthen cross-organization inventory planning.
The results:
- 9% parts sales increase
- 8% inventory reduction of non-moving parts
- Average reduction of planning time by 3 hours
Capturing the maximum value of targeted transparency
As CPG organizations ramp up their data-driven decision-making capabilities, they need to remember that the power of data cuts both ways. Clean, timely, relevant data gathered in a standardized way across sources will help the business make better, smarter, faster decisions. But inaccurate or incomplete data misinforms decision processes. In other words: garbage in, garbage out.
With targeted transparency, it's also important to remember that calculating key metrics isn't just about the immediate benefits like reducing fines. It's also a means of increasing productivity, improving forecasting, and optimizing resources, which makes for a healthier, more agile, and resilient business.
This point of view was authored by Luis Dominguez, supply chain solutions, Genpact.
Visit our supply chain management page
Share